Ask three systems for your ARR and you'll get three answers.
The CRM counts bookings, billing counts invoices, and the spreadsheet counts whatever was true at the last month-end. Before anyone can explain a number, someone has to reconcile it.
Revenue Insights now gives you complete revenue visibility across your customers, based on the contracts, usage, invoices, and payments you already manage in Alguna.
In Alguna, each customer has one agreement. The quote they sign becomes their subscription, and invoices, payments, and revenue schedules all read from it.
Revenue Insights does, too.
Every number traces back to the contract:
- ARR opens to the movements behind it.
- Each movement opens to the customers who drove it.
- Each customer opens to their subscriptions and products.
- Each subscription opens to the terms and prices that set the number.
What does that mean in practice? No more revenue surprises.
Let's see exactly what this looks like in Alguna.
See what’s already booked
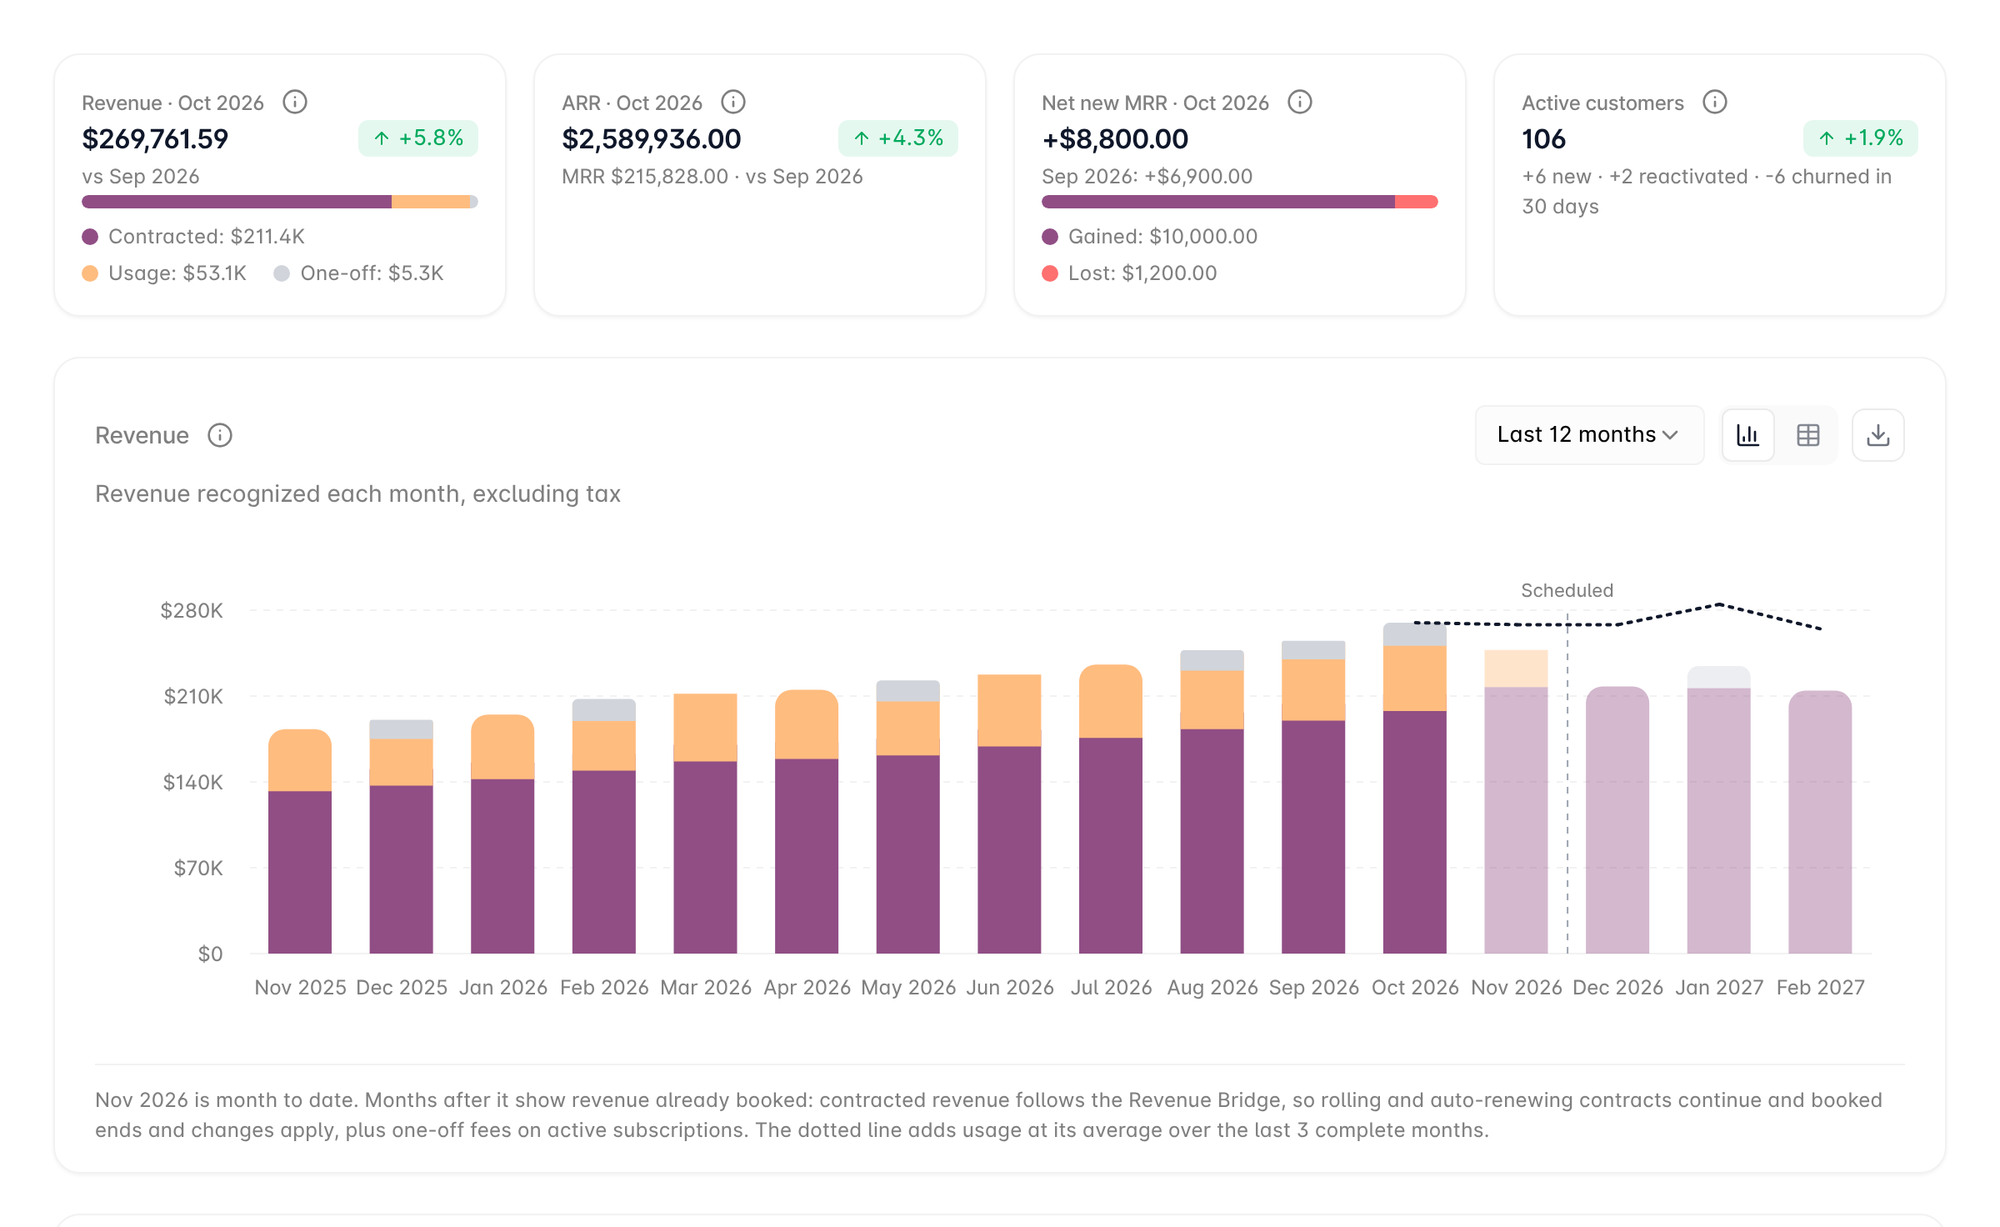
The Revenue tab shows recognized revenue, ARR, net new MRR and active customers side by side.
The months ahead aren’t a forecast, instead, they show what’s already booked: renewing contracts continue and scheduled ends and price changes apply, before any new sales.
Revenue Bridge: Where ARR moved, and why
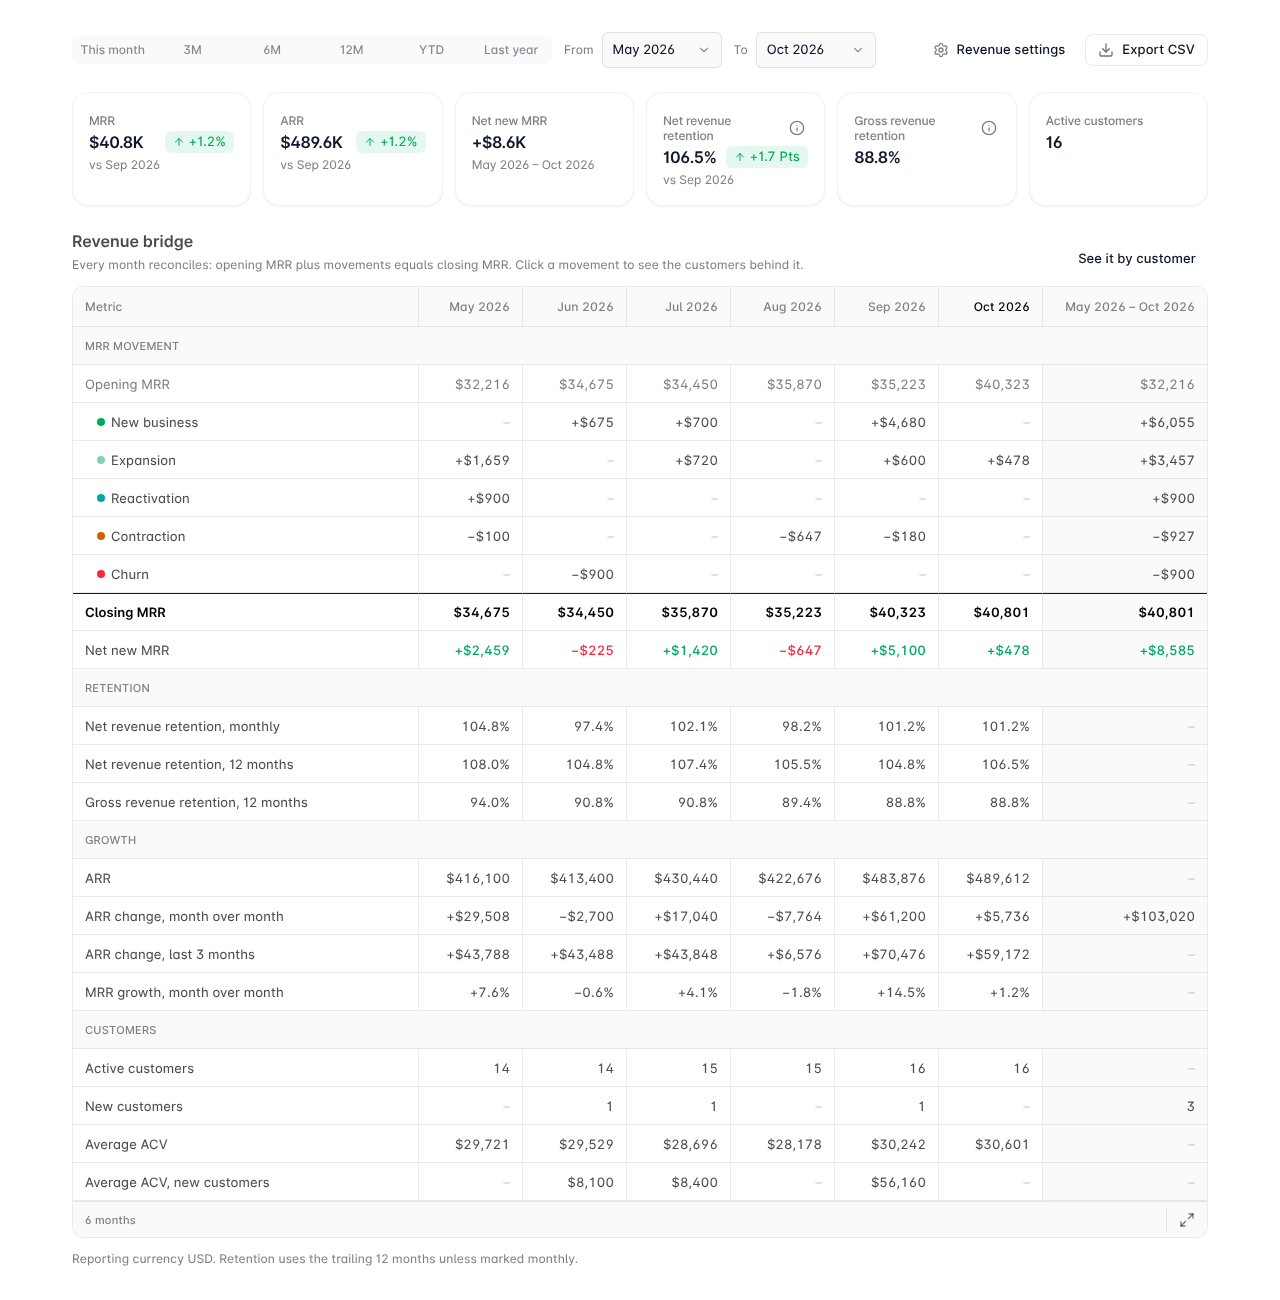
When ARR moves, the board’s first question is why.
The answer usually lives in a spreadsheet where someone classified every subscription change by hand. One wrong row in March throws off every month after it.
The revenue bridge does that classification for you. It splits each month’s change into five movements:
- New business: customers who started that month
- Expansion: existing customers paying more, from added units or a higher price
- Reactivation: customers who came back after churning
- Contraction: existing customers paying less
- Churn: customers who left
Opening MRR plus the movements equals closing MRR, every month, to the dollar.
Below the movements, the same table carries the metrics you’d otherwise calculate by hand:
- Retention: net revenue retention, monthly and over 12 months, and gross revenue retention
- Growth: ARR, its change month over month and over the last three months, and MRR growth
- Customers: active and new customers, average ACV, and average ACV of new customers
Read across the range, the bridge shows where ARR came from and where it leaked:
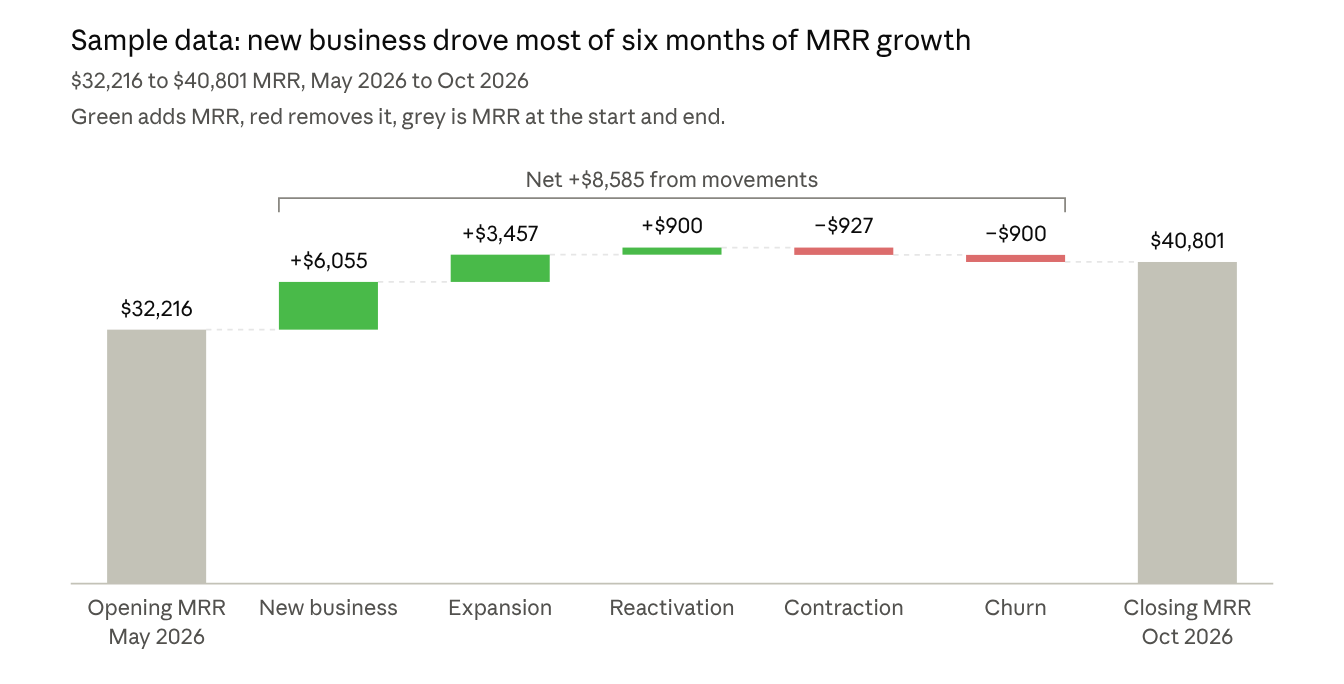
That’s where. For why, click any movement in any month. A drawer lists the customers behind it, what each one moved and their share of opening MRR.
You can step to the month before or after without closing the drawer.
Click See it by customer to open the same months, customer by customer.
Customer Waterfall: What each customer pays for and why it changed
The bridge says expansion added $41,484 of ARR. The next question is always who, and for what. Until now, answering it meant lining up monthly exports, then opening each contract to see whether a change was seats or price.
The customer waterfall lists every customer’s MRR month by month, with a badge for the range: New, Expanded, Reactivated, Contracted or Churned. Each row also shows contracted ACV, the annual value the contract commits to.
Expand a customer to see each subscription and the products on it, every line with its own MRR. Amounts that apply to the whole contract, such as a contract-wide discount, get their own Contract terms line.
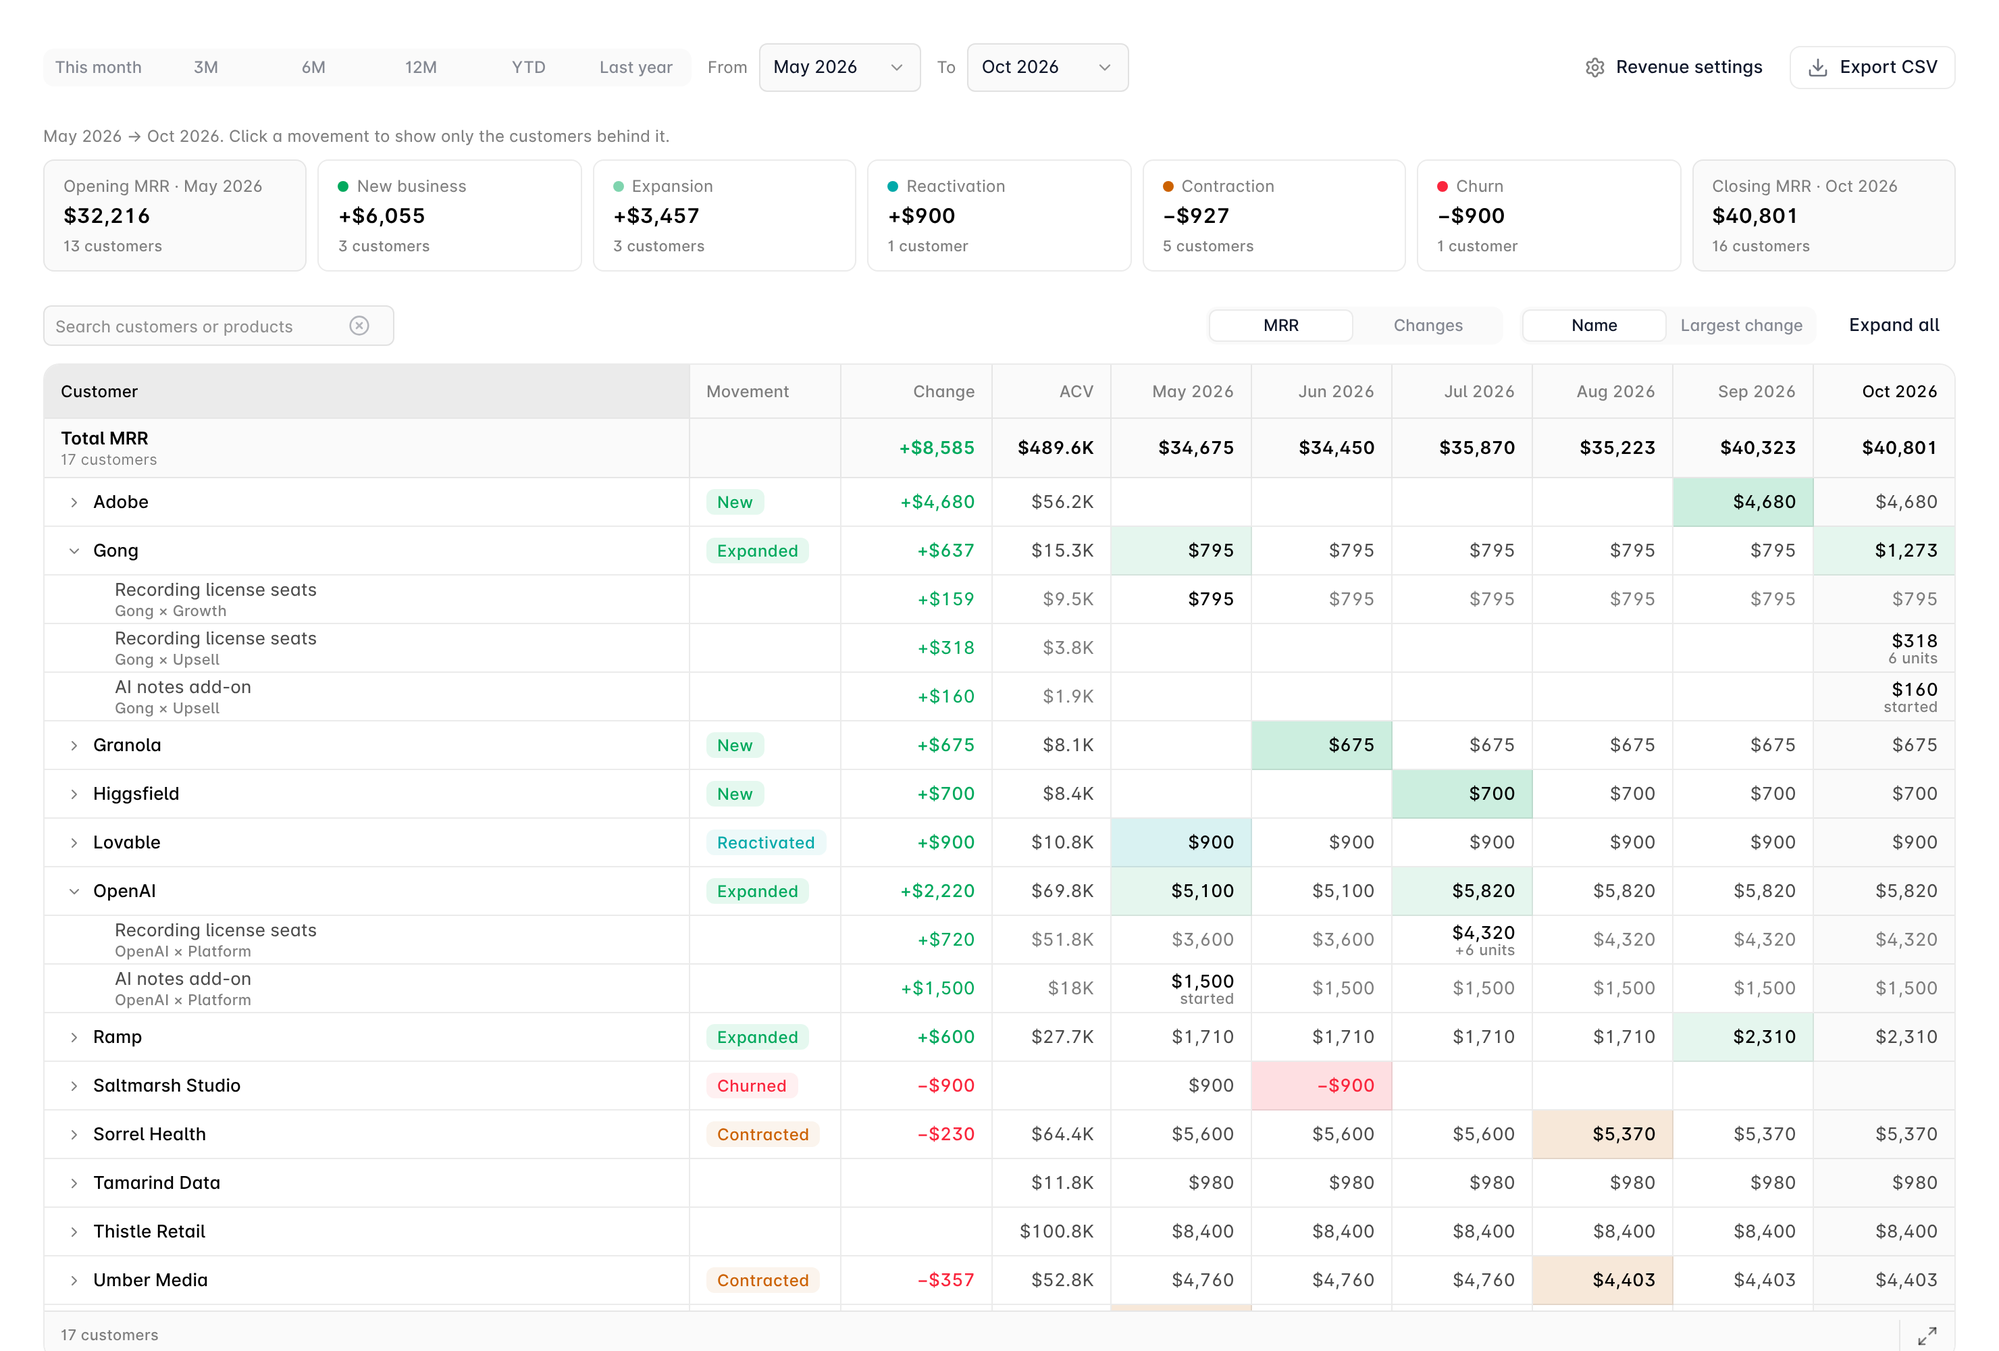
Months where MRR moved are shaded, and each product line says why:
- +6 units or −2 units when the quantity changed
- price change when the units held and MRR still moved
- started or ended when a product was added or removed
When a customer drops from 40 seats to 38, you see −2 units on the seats line in that month. No more guessing whether a dip was seats or a discount.
From there:
- Click a movement in the summary bar, and the table filters to those customers. Click Churn, and you have your churn list for the quarter.
- Click a customer for their own waterfall: MRR by month, change across the range, contracted ACV and a list of what changed.
- Click a subscription to open the contract behind the line.
- Switch, sort, search, export. View MRR or month-over-month changes, sort by largest change, search by customer or product, and export to CSV.
Multi-currency ARR: Count revenue the way your finance team does
If you sell in several currencies, your board deck probably uses a budget rate, not today’s spot rate. Some teams track MRR on what’s contracted, others on what’s billed.
A dashboard that picks for you just gives you a second set of numbers to reconcile.
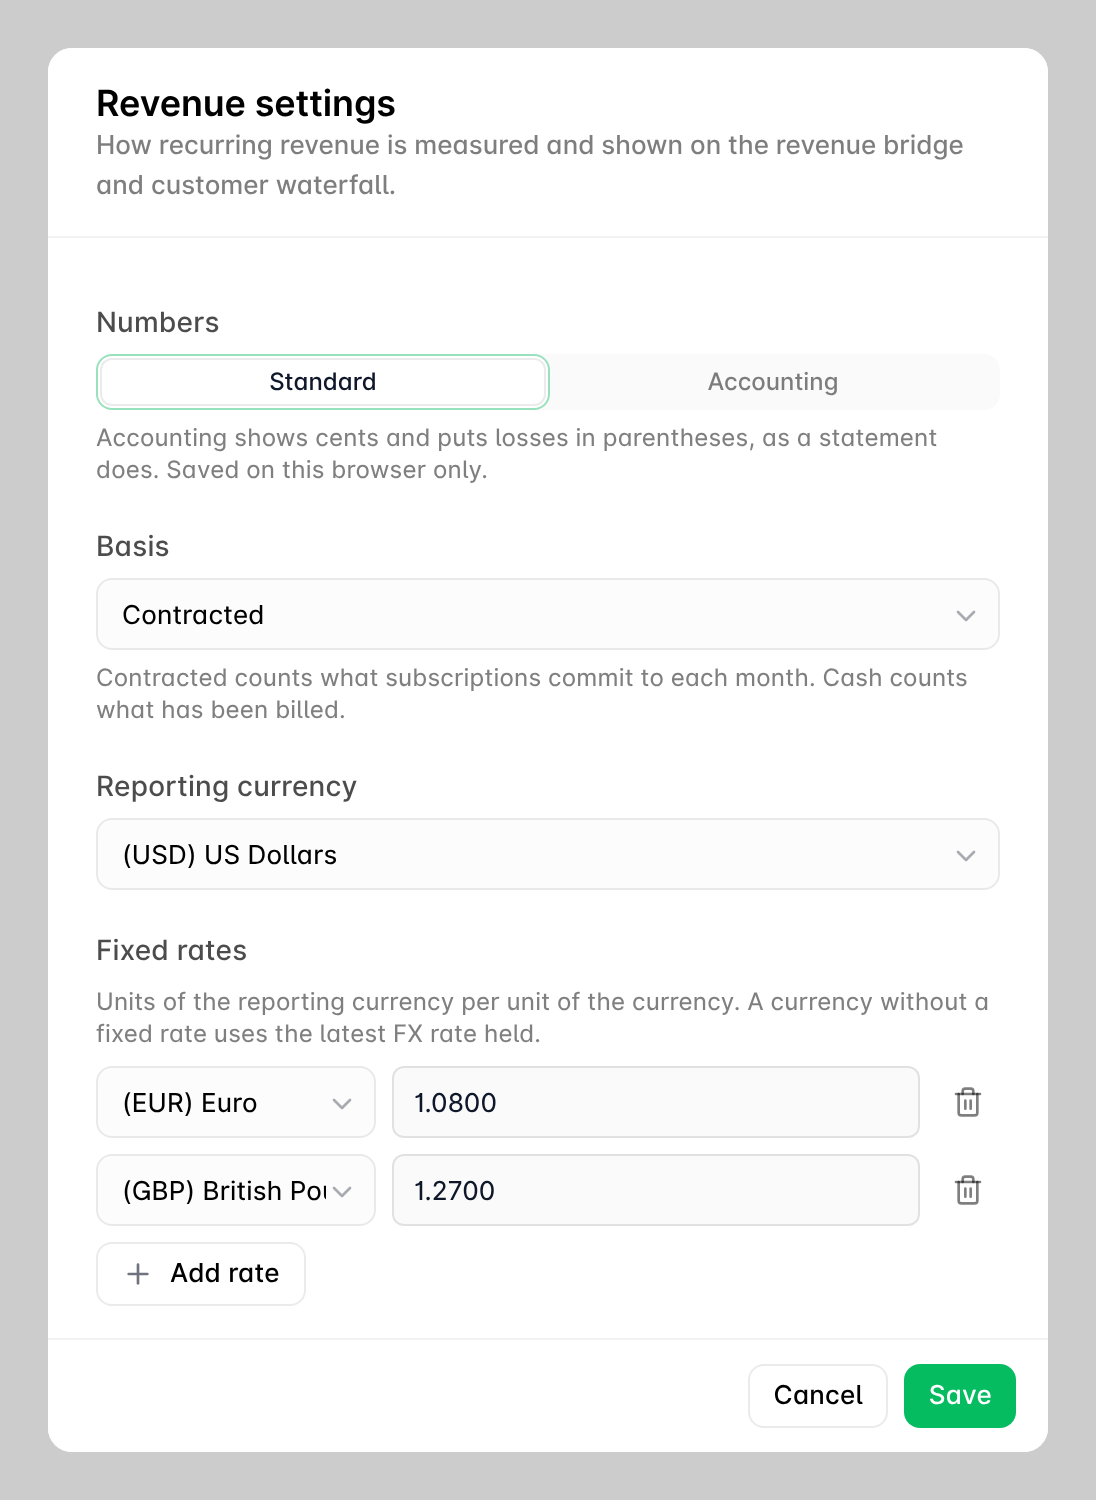
Revenue settings sets how every figure is measured:
- Basis: contracted (what subscriptions commit to each month) or billed (what’s been invoiced)
- Reporting currency: every amount converts into it
- Fixed FX rates: your own rate per currency, such as your budget rate. Currencies without one use the latest FX rate Alguna holds.
- Number style: standard, or accounting, which shows cents and puts losses in parentheses
Basis, currency and rates apply to everyone on your account, so finance, sales and the board read the same numbers. Number style is personal and saved in your browser.
Ask Una AI about MRR, ARR and retention
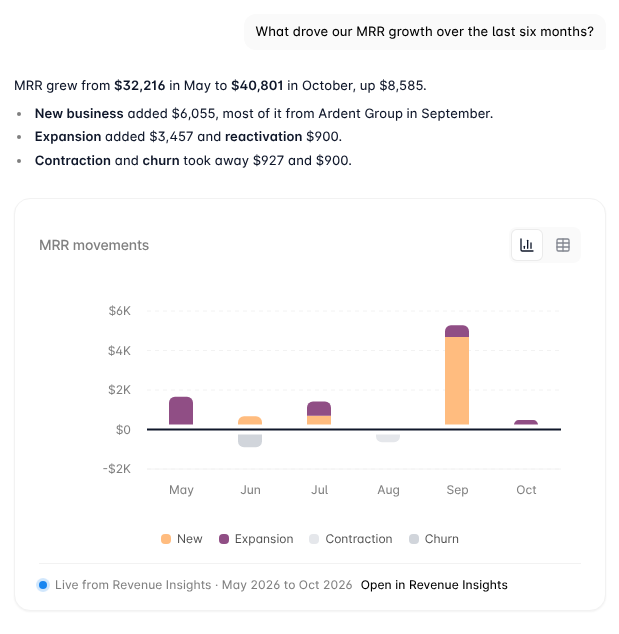
Una, the AI assistant in your Alguna dashboard, reads from the same bridge. Ask “what was net new MRR last quarter?” or “what drove our MRR growth over the last six months?”
Una answers with a live card that uses your saved basis, currency and rates, so its numbers match the bridge exactly. The card links straight to the revenue bridge for the same months.
Get started
Open Revenue Insights in your Alguna dashboard and pick the Revenue Bridge or Customer Waterfall tab.
Both build from the subscriptions you already have in Alguna, so there's nothing to import, map or set up.
To change the basis, currency or rates, click Revenue settings on either tab.
That's your month-end ARR bridge, traced to the contract, before you open a spreadsheet.
Log in to get complete revenue visibility.
Frequently asked questions
What’s the difference between an ARR bridge and an MRR bridge?
They show the same movements at different scales. An MRR bridge tracks monthly recurring revenue. An ARR bridge annualizes it (MRR × 12). Alguna calculates movements in MRR and shows ARR alongside them.
What’s the difference between expansion and reactivation MRR?
Expansion comes from existing customers paying more, through added units or a higher price. Reactivation comes from customers who had churned and came back.
What’s the difference between net revenue retention and gross revenue retention?
Net revenue retention includes expansion, so it can go above 100%. Gross revenue retention counts only what you kept after contraction and churn, so it tops out at 100%.
Do I need to import data to build an ARR bridge in Alguna?
No. The revenue bridge and customer waterfall are built from the subscriptions already in Alguna, so there’s nothing to import, map or set up.
Can I export the ARR bridge for a board deck?
Yes. Both views export to CSV with every metric and every customer row.